Coursera.org 에서 Michigan University의 Applied Data Science with Python의 강의를 토대로 정리한 내용입니다.
이제까지 다뤘던 method와 라이브러리를 활용하여 움직이는 animation이나 사용자들과 상호작용하는 interactive한 데이터표현을 알아보자.
먼저 간단하게 plotting 되는 과정을 animation으로 어떻게 표현할 수 있을 지 히스토그램을 예시로 알아보도록 하자.
코드는 다음과 같다.
#이렇게 animation을 import해준다.
import matplotlib.animation as animation

#크기 100의 랜덤 분포에 대해서 살펴보자.
n = 100
x = np.random.randn(n)

# create the function that will do the plotting, where curr is the current frame
# 그려줄 함수를 생성하여 animation 함수에 할당하여 줍니다.
def update(curr):
    # check if animation is at the last frame, and if so, stop the animation a
    # 만약 현재상황이 100개까지 왔다면 그만한다.
    if curr == n:
        a.event_source.stop()
    plt.cla() #current axis를 초기화해줍니다.
    bins = np.arange(-4, 4, 0.5) #bin의 넓이 지정
    plt.hist(x[:curr], bins=bins) #그리는 curr이 점점 커집니다.
    plt.axis([-4,4,0,30])
    plt.gca().set_title('Sampling the Normal Distribution')
    plt.gca().set_ylabel('Frequency')
    plt.gca().set_xlabel('Value')
    plt.annotate('n = {}'.format(curr), [3,27]) #3,27d은 좌표다.

fig = plt.figure()
a = animation.FuncAnimation(fig, update, interval=100)
뭔가 알게되어서 신기하긴 하지만 앞으로 자주 쓸 것 같지는 않다..
다음은 처음 데이터 시각화를 공부할때부터 궁금했던 interactive한 데이터표현에 대해서 알아보겠다.
깊게는 들어가지 말고 간단히 이것도 이런게 있구나 정도만 알아보자.
#java같이 onclick이나 onpick method를 이용한다.

plt.figure()
data = np.random.rand(10)
plt.plot(data)

def onclick(event):
    plt.cla()
    plt.plot(data)
    plt.gca().set_title('Event at pixels {},{} \nand data {},{}'.format(event.x, event.y, event.xdata, event.ydata))

# tell mpl_connect we want to pass a 'button_press_event' into onclick when the event is detected
plt.gcf().canvas.mpl_connect('button_press_event', onclick)

#위가 출력하는 함수는 아래와 같이 클릭한 좌표를 title로 출력한다.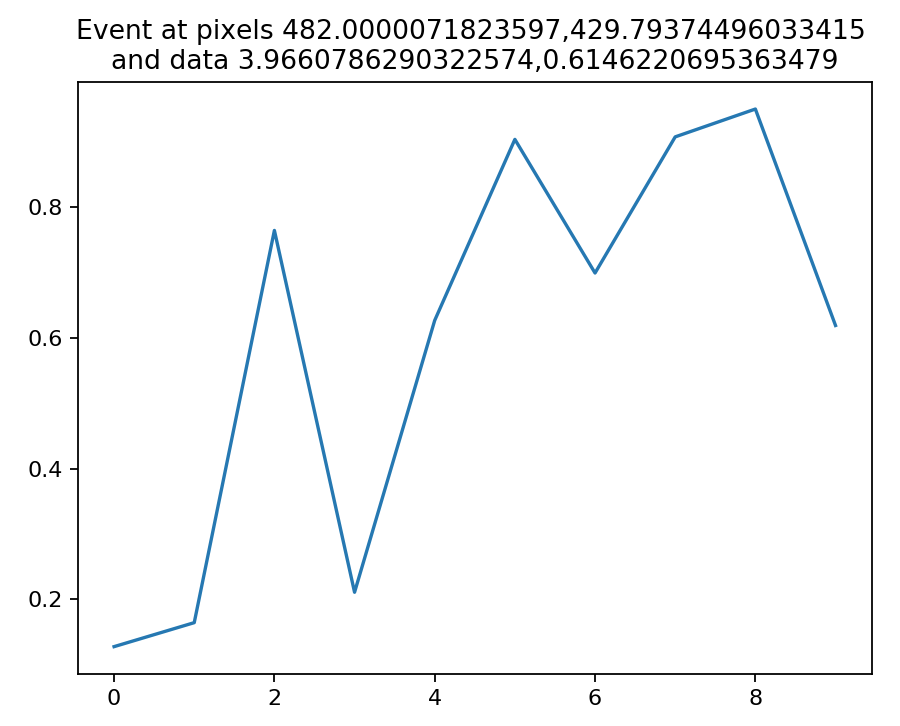
from random import shuffle
origins = ['China', 'Brazil', 'India', 'USA', 'Canada', 'UK', 'Germany', 'Iraq', 'Chile', 'Mexico']

shuffle(origins)

df = pd.DataFrame({'height': np.random.rand(10),
                   'weight': np.random.rand(10),
                   'origin': origins})

plt.figure()
# picker=5 means the mouse doesn't have to click directly on an event, but can be up to 5 pixels away
plt.scatter(df['height'], df['weight'], picker=5)
#picker는 pick이라고 생각하는 범위라고 생각하면 된다. 5는 5pixel을 의미한다.
plt.gca().set_ylabel('Weight')
plt.gca().set_xlabel('Height')

def onpick(event):
    origin = df.iloc[event.ind[0]]['origin']
    plt.gca().set_title('Selected item came from {}'.format(origin))

# tell mpl_connect we want to pass a 'pick_event' into onpick when the event is detected
plt.gcf().canvas.mpl_connect('pick_event', onpick)

#위의 함수도 비슷하게 해당 데이터포인트를 클릭하면 onpick에서 설정한 함수를 실행하여 좌표의 origin값을 보여주게 된다.
끝.
'Programming > Data mining' 카테고리의 다른 글
| Z-test, T-test, Paired T-test, ANOVA test 비교 (0) | 2020.06.10 |
|---|---|
| 9. Pandas Visualization / 코세라(COURSERA) 수료증_python (0) | 2020.02.26 |
| 7. Boxplot, Heatmap _ python (0) | 2020.02.16 |
| 6. Subplots, Histograms _ python (1) | 2020.02.16 |
| 5. Scatterplots, Line plots, Bar charts _ python (0) | 2020.02.12 |


